ArchivedFull-stack
VizIoT
IoT data visualization platform
Tech stack
- Node.js
- Express.js
- SQLite
- JavaScript
- Bootstrap
- GR Framework
Status
Archived
Overview
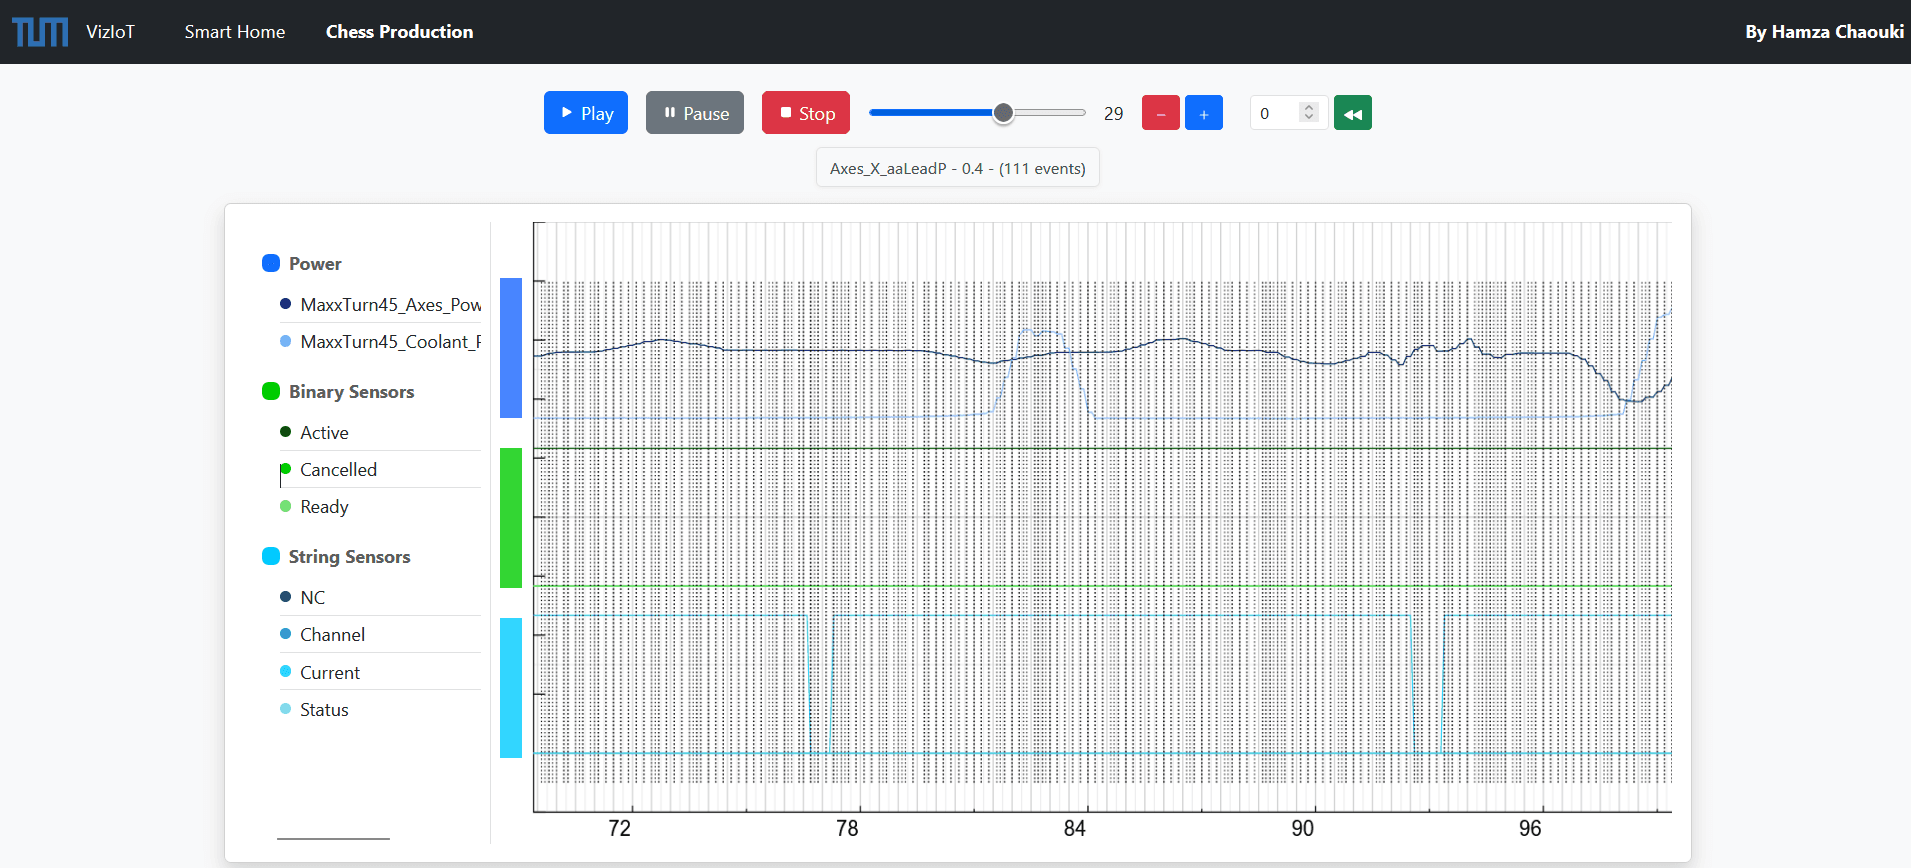
VizIoT was developed as the practical artifact of my B.Sc. thesis. It solves the problem of making raw IoT sensor streams comprehensible to non-technical users by offering an interactive dashboard with live-updating charts. The back-end (Node.js + Express) ingests telemetry via REST endpoints and persists it in SQLite, while the front-end renders data with the scientific-grade GR Framework for high-performance 2D/3D plots. I designed the full architecture, implemented both client and server, and benchmarked rendering performance under varying data volumes.
What it achieves
- 1Real-time IoT sensor data visualization
- 2Interactive dashboards with GR Framework
- 3Lightweight SQLite-based data storage
Features
- Live-updating scientific charts powered by GR Framework
- REST API for sensor data ingestion
- Configurable dashboard layout
Challenges
- Rendering thousands of data points in real time without UI jank
- Designing a lightweight storage layer that scales to weeks of sensor history